
lambda-perf

Lambda Cold Starts analysis, updated daily
Observability
🔄 Continous Lambda Cold Starts Benchmark
TL;DR: 👀 to https://maxday.github.io/lambda-perf/
to see the benchmark result:

Why?
There are already a lot of blog posts talking about Lambda Cold Starts performance per runtime but I could not find any always up-to-date information.
That's why I decided to create this project: data is always up to date as the benchmark is running daily.
How does it work?
Architecture diagram
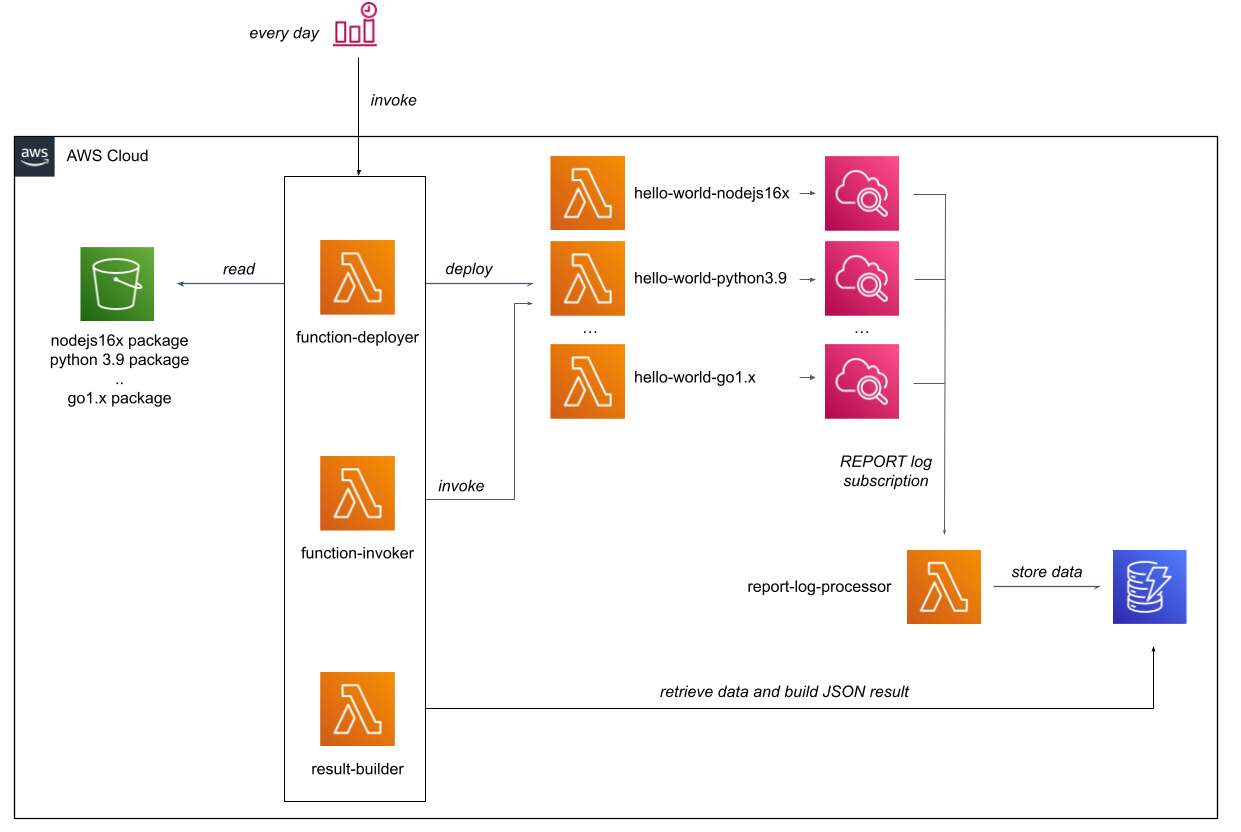
Step 1
An ultra simple hello-world function has been written in each AWS supported runtime:
nodejs16.xnodejs18.xnodejs20.xnodejs22.xpython3.8python3.9python3.10python3.11python3.12python3.13dotnet6java11java11 + snapstartjava17java17 + snapstartjava21java21 + snapstartruby3.2ruby3.3
in addition to the following custom runtimes:
goonprovided.al2goonprovided.al2023rustonprovided.al2rustonprovided.al2023c++onprovided.al2c++onprovided.al2023dotnet7 aotonprovided.al2dotnet8 aotonprovided.al2dotnet8 aotonprovided.al2023quarkus nativeonprovided.al2graalvm java17onprovided.al2graalvm java21onprovided.al2023graalvm java23onprovided.al2023apple swift 5.8onprovided.al2bunonprovided.al2(with and without layer)llrtonprovided.al2023
Each of this function is packaged in a zip file, uploaded to a S3 bucket.
Step 2
Every day, each function is freshly grabbed from S3, deployed and invoked 10 times as cold starts.
Then the REPORT log line containing the init duration, max memory used and other useful information is saved to a DynamoDB table.
Step 3
After all these invocations, all information stored in DynamoDB is aggregated and a new JSON file is created, then commited to this repo. ie: https://github.com/maxday/lambda-perf/blob/main/data/2022-09-05.json
Step 4
A static website, hosted on GitHub pages here: https://maxday.github.io/lambda-perf/ fetches this JSON file and displays the result in a (nice?) UI.
Step 5
Hack/Fork/Send PR and create your own benchmarks!
Disclaimer
⚠️ This project is not associated, affiliated, endorsed, or sponsored by any companies nor have they been reviewed tested or certified by any company.